As simple as it gets...
 Welcome to the OLAPmapper pages, an OLAP engine written in Java. It enables you to interactively analyze very large datasets stored in SQL databases without writing SQL queries. An Olap query consists of a classifier, a measure and an aggregation operation. The user chooses the classifier, the measure and the operation by clicking directly on the visualization of a dimensional schema. User choices are then passed to the OLAPmapper for building an SQL query. The query result is returned to the user in the form of a relational table. The user has two possibilities:
- export the result to a CSV file (and then to Microsoft Excel or to other spreadsheet editors)
- or to visualize the result (by choosing one among a number of available templates)
A Functional model for data analysis
The OLAPmapper application is based on previous work by Prof. Nicolas Spyratos and Prof. Michel de Rougemont. The functional data model and OLAP query language on which the OLAPmapper is based can be found in this paper.
Requirements
- JRE 1.5+
- Database (all kind of JDBC supported, tested with MySQL and Oracle)
Installation
Set up test data
OLAPmapper has been tested with the 'FoodMart' example dataset. This dataset is shipped in one of two formats: MySQL SQL file and Oracle DDL. For other types of databases, refer to the Mondrian tool.
Application
There are several possibilities to start an application. The first is to download the binary release package to some folder, extract it, and then run the olapmapper.jar file. On MS Windows this can be done by just double-clicking on the jar file, in other cases you can use the following command to start an application:
java -jar olapmapper.jar
The second possibility is to use Java Web Start. Just deploy shipped WAR file on your application server and point your browser to it. In case that you prefer a standard web server like Apache httpd, extract the WAR file (it's a standard ZIP file) to some web folder and replace the file launch.jnlp by the file launch-http.jnlp. Then change the codebase attribute to your web server directory path. This attribute is located on the second row of the replaced launch.jnlp file.
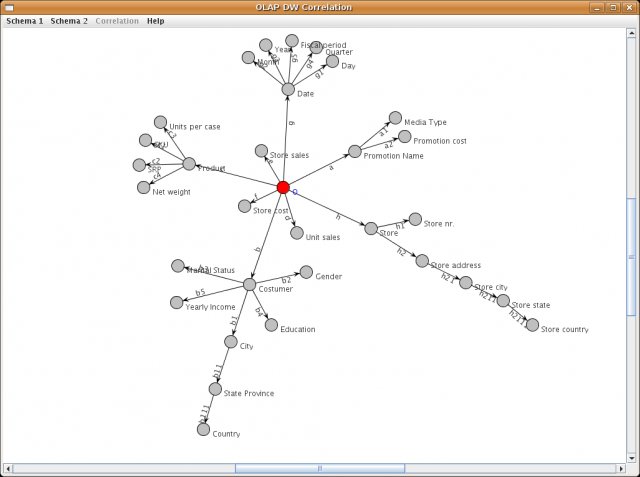
After starting the application, you will see a screen such as this one
Configuration
In the directory of the application you’ll find a file named settings.ini with content similar to the following one:
db.query.cubes.enabled=false
db.query.create_view=true
service.verdolap.enabled=true
service.verdolap.uri=http://195.168.5.238:9876/VERDOLAP/
If you want to use the CUBE command, you’ll have to enable the db.query.cubes.enabled parameter. If you want to visualize the result of the query, then you’ll have to enable the db.query.create_view parameter.
Menu functions
In the main menu you can choose one of the following items:
- Schema - Items related to schema visualization, queries and datamarts.
- Correlation - Currently not available
- Help - Application help
In the schema menu you can find the following items:
- Load XML description - loads XML file, which describes the dimensional schema and it's mapping into a relational star schema.
- Show schema - shows star schema
- Query - tool for defining and executing queries on the dimensional schema
- Datamart - tools for creating datamarts based on the main schema
- Load - loads a datamart from a specified file
- Define - defines a new datamart
- Show schema - shows a datamart schema
- Save – saves a defined datamart into the specified file
- Query - tool for defining and executing queries on a datamart
The XML description of a star schema uses a special application format based on GraphML. . For 'FoodMart' test data please download the file foodmart.xml and change the connection details according to your database. An OLAPmapper application needs at least 'SELECT' privileges. You also need 'CREATE VIEW' privileges if you want to visualize the result of a query.
Graph visualization

In the schema visualization, you can use the mouse to manipulate nodes. There are three possible moves:
- Zooming with the mouse scroll wheel
- Dragging the graph using the right mouse button
- Dragging graph nodes using the left mouse button
Query definition

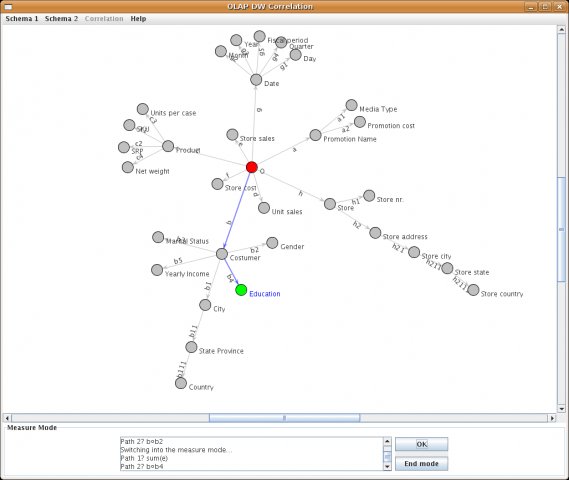
After switching to query definition mode, the user chooses a classifier for the OLAP query using a left mouse click on each desired node and then confirms by clicking on the OK button. As a result, for each selected node, the shortest path from the root to that node is chosen. Another possibility is to choose the desired path by clicking on all edges of the path. The classifier definition is terminated by clicking on the End mode button, to pass on to the measure mode. In this mode the user defines a number of pairs >measure, operation<. A measure is defined in the same manner as a classifier. As soon as a measure is defined, the system pops up a menu of possible operations for the user to select one.

Finally, by clicking the End-mode again, the user obtains the result in the form of a table. However, only the first 100 rows of this table are shown (because of memory limitation). To see the whole result in the form of a table you have to export the result into the CSV file (or else you can visualize the whole result).
Datamart definition
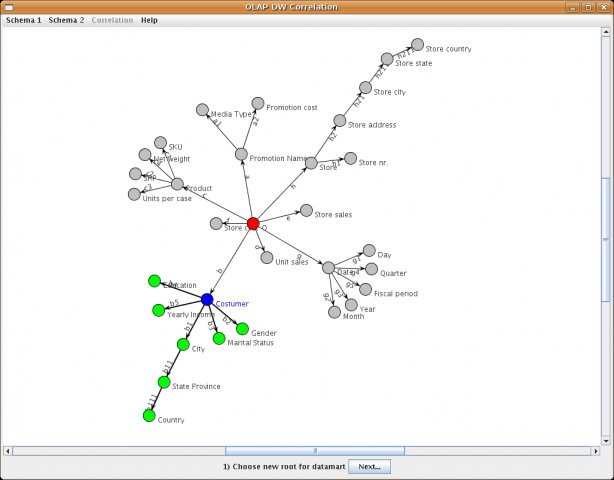
The user has possibility to define a datamart and execute queries on it. When the datamart definition mode is selected, a pop-up menu appears where the user can input a datamart name. Then the schema becomes visible and an origin is selected for the datamart by clicking on the desired node. As a result, the subschema rooted in that node is selected. At this point, the subschema and the new root are highlighted (the new root in blue, all other nodes in green). The user then selects the desired (non root) nodes in the subschema, and one new arrow is defined for each selected node (as the composition of the arrows leading from the root to that node).The datamart schema consists then of the selected root and the newly defined arrows.

After confirmation only the selected datamart schema is shown, and manipulation of that schema is as for a usual dimensional schema. Afterwards is datamart created and new submenu occurs under Datamart menu item.
Visualization
Currently ongoing, due to licence problems.
Extended GraphML file
Basic concept
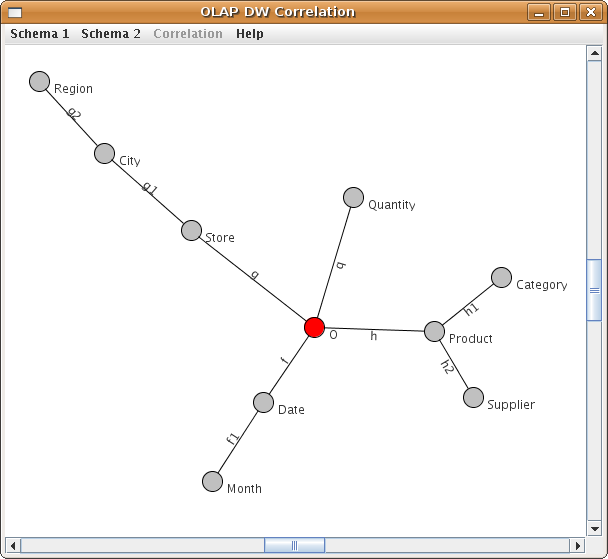
The purpose of a extended GraphML document is to define a graph together with mapping it into relational database model. Let us start by considering the graph shown in the figure below. It contains 10 nodes and 9 edges.

A Simple Graph
The graph is contained in the file simple.xml
<graphml xmlns="http://graphml.graphdrawing.org/xmlns">
<db_connection>
<property name="driver_class" value="oracle.jdbc.driver.OracleDriver" />
<property name="connection_string" value="jdbc:oracle:thin:datamart/datamart@localhost:1521:xe" />
<property name="username" value="datamart" />
<property name="password" value="d4t4m4rt&" />
<property name="schema" value="DATAMART" />
</db_connection>
<graph id="G" edgedefault="undirected">
<node id="O" name="O" table="sales_fact_1998" />
<node id="Quantity" name="Quantity" column="quantity" type="num" />
<node id="Store" name="Store" column="store" type="string" />
<node id="City" name="City" column="city" type="string" />
<node id="Region" name="Region" column="region" type="string" />
<node id="Date" name="Date" column="date" type="date" />
<node id="Month" name="Month" column="month" type="num" />
<node id="Product" name="Product" column="product" type="string" />
<node id="Supplier" name="Supplier" column="supplier" type="string" />
<node id="Category" name="Category" column="category" type="string" />
<edge source="O" target="Store" name="g" table="StoreT" foreignKey="store" />
<edge source="O" target="Date" name="f" table="DateT" foreignKey="date" />
<edge source="O" target="Product" name="h" table="ProductT" foreignKey="product" />
<edge source="O" target="Quantity" name="q" />
<edge source="Store" target="City" name="g1" />
<edge source="City" target="Region" name="g2" />
<edge source="Date" target="Month" name="f1" />
<edge source="Product" target="Category" name="h1" />
<edge source="Product" target="Supplier" name="h2" />
</graph>
</graphml>
Header
In this section we discuss the parts of the document which are common to all GraphML documents, basically the graphml element.
<graphml xmlns="http://graphml.graphdrawing.org/xmlns">
The first line of the document is an XML process instruction which defines that the document adheres to the XML 1.0 standard and that the encoding of the document is UTF-8, the standard encoding for XML documents. Of course other encodings can be chosen for GraphML documents.
The second line contains the root-element element of a GraphML document: the graphml element. The graphml element, like all other GraphML elements, belongs to the namespace http://graphml.graphdrawing.org/xmlns. For this reason we define this namespace as the default namespace in the document by adding the XML Attribute xmlns="http://graphml.graphdrawing.org/xmlns" to it. The XML Schema reference is not compatible with GraphML and in that case we don't use it.
Database connection details
<property name="driver_class" value="oracle.jdbc.driver.OracleDriver" />
<property name="connection_string" value="jdbc:oracle:thin:datamart/datamart@localhost:1521:xe" />
<property name="username" value="datamart" />
<property name="password" value="d4t4m4rt&" />
<property name="schema" value="DATAMART" />
</db_connection>
In database connection configuration are user JDBC driver connection details. Please consult manual of your JDBC driver for more information.
The Graph
A graph is, not surprisingly, denoted by a graph element. Nested inside a graph element are the declarations of nodes and edges. A node is declared with a node element, and an edge with an edge element.
Declaring a Graph
In compare with standard GraphML, all edges are directed in our file. An identifier for the graph has to be specified with the XML Attribute id. The identifier is used, when it is necessary to reference the graph.
Declaring a Node
Nodes in the graph are declared by the node element. Each node has an identifier, which must be unique within the entire document, i.e., in a document there must be no two nodes with the same identifier. The identifier of a node is defined by the XML-Attribute id.
Declaring an Edge
Edges in the graph are declared by the edge element. Each edge must define its two endpoints with the XML-Attributes source and target. If the value of the source, resp. target, must be the identifier of a node in the same document.
Optionally an identifier for the edge can be specified with the XML Attribute id. The id XML-Attribute is used, when it is necessary to reference the edge.
GraphML extensions
Root node
In graph definition has to be defined exactly one root node. This one has attribute id set to name O. This node has special attribute called table which define name of the fact table.
Node
Our node element has in addition those attributes:
id-nodeidentifier, has to be unique for graphname- shown name ofnodecolumn- column name of relational tabletype- type of the column, can be one of the following: num, string, date
Edge
Attributes of edge can be one those:
source- sourcenodeofedgetarget- targetnodeofedgename- shown name ofedgetable- optional - in case thatedgepresents join to other table, here would be new table nameforeignKey- optional - the fact table keykey- optional - in case that key of the new table isn't equal tocolumnattribute of targetnode, here is place to define it
Javadoc API
You can find java documentation here.
